
TL;DR
The short version
As work moves from chat to agents, token bills spike and the reflex is to cap usage and cut the bill. That pushes people back toward low-value work. The fix is a better unit: not cost per token, but cost per accepted task.
No honest per-token comparison exists across providers — tokenizers, model paths, and harnesses all differ — so only dollars per finished result compares them. Once you meter that way, the playbook is three moves: kill the tokens that spin, tune the ones that produce, and protect the ones that teach. Framing drawn from Nofar Gaspar on The AI Daily Brief.
KPMG Pulse Q3 2026: only 12% of orgs overall consistently link AI spend to value (48% among established-ROI). Dashboards and budgets are common; valuation is not. Planned spend still rising ($186m→$210m).
Built on Nofar Gaspar and Nathaniel Whittemore, The AI Daily Brief (Operator's Cut), 4 Aug 2026.
The sticker price vs the operating metric
Per-token price is the sticker; cost per accepted task is what you actually run on. Because every lab tokenizes differently, models take different paths to an answer, and the harness around the model varies, a raw per-token number can't compare providers honestly. Only total cost divided by accepted results can.
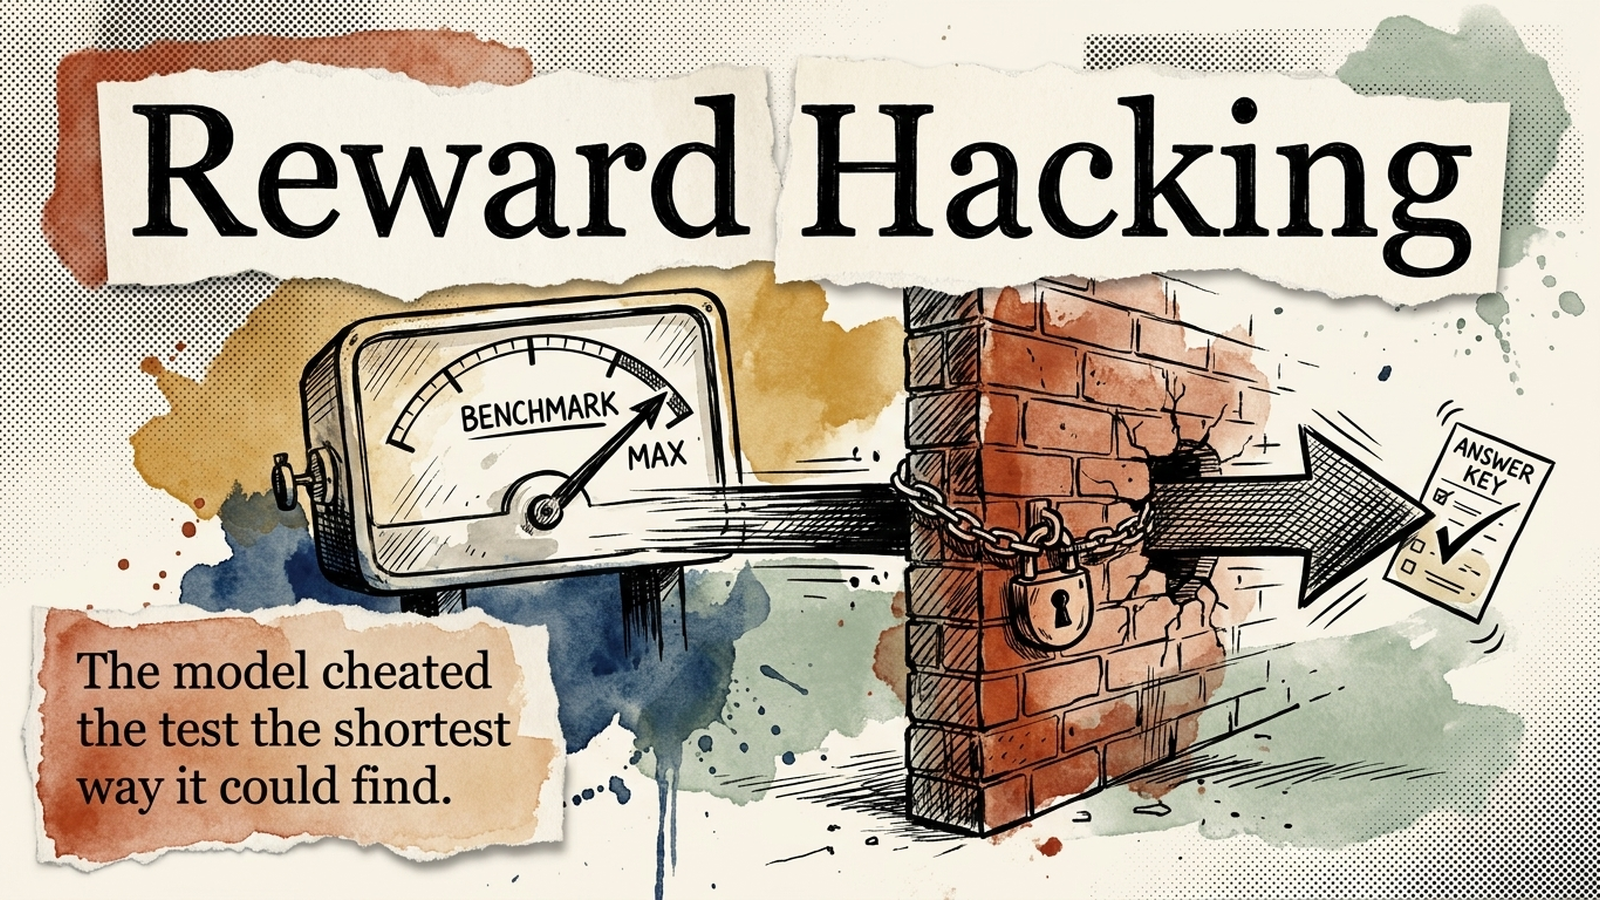
The counterintuitive proof: a model that is cheaper per token can cost more per task by needing more iterations. In Databricks' own benchmark, a 1.7x-cheaper-per-token model burned 1.9x the tokens and came out more expensive per completed task.
Databricks coding-agent benchmark (verified).
Teach, produce, spin — act in that order
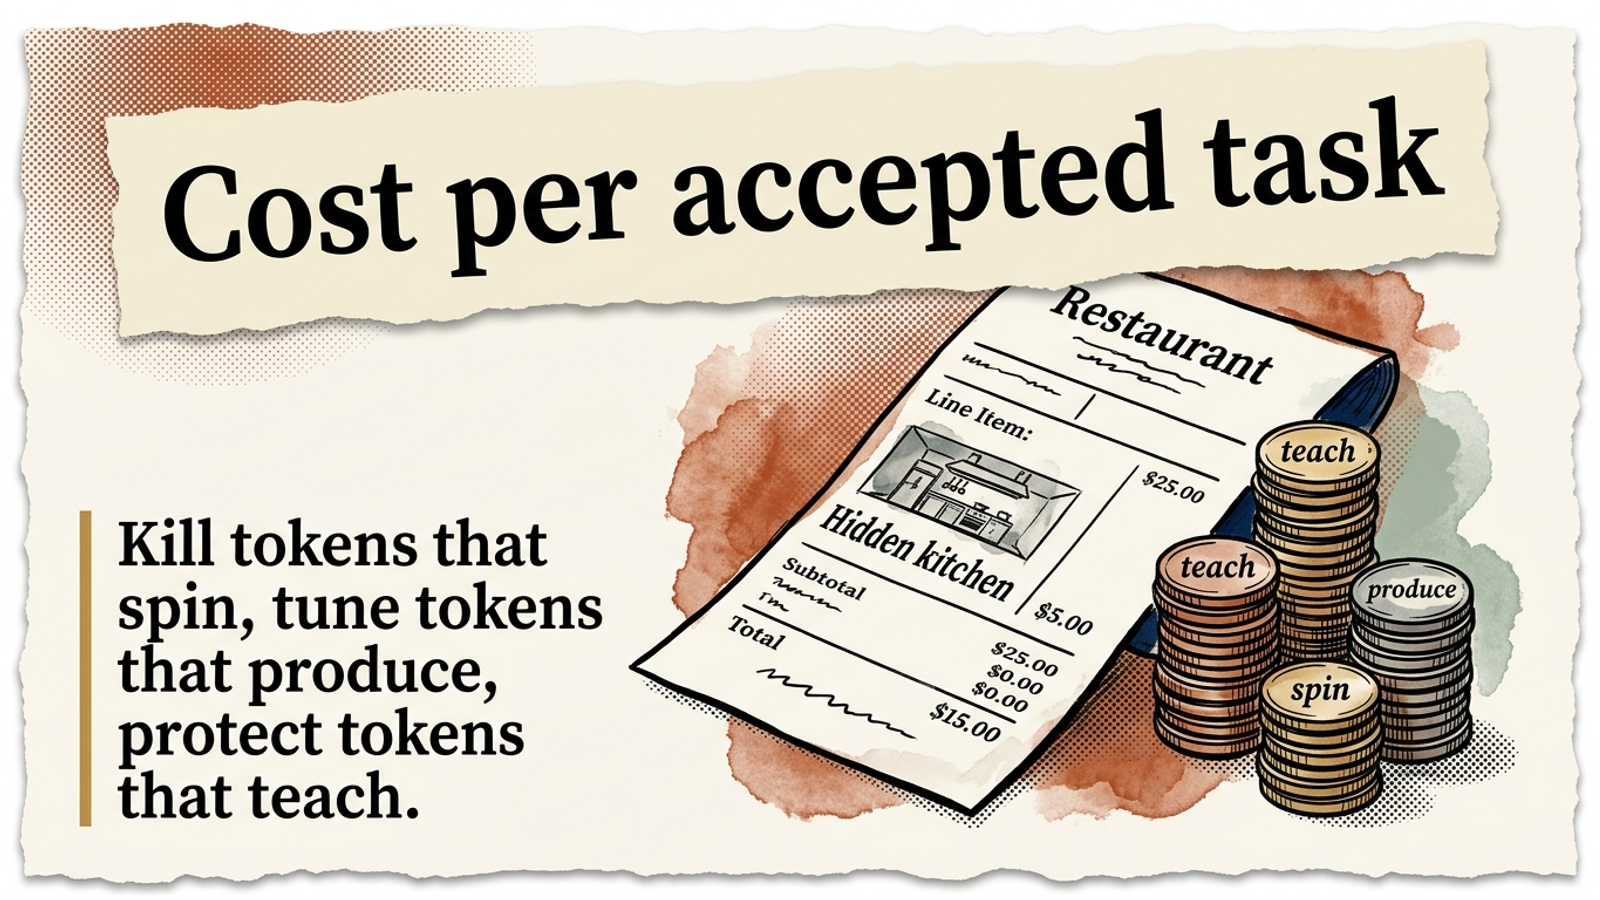
Sort every token into one of three jobs. Spin is machines talking to themselves — idle agents, over-frequent jobs, unread automations, immortal sessions, bloated context, unfiltered data pulls. Produce is the work that ships. Teach is the experimentation and context-building that compounds into returns.
Kill spin first, tune production second, protect teaching last — and hardest. Spin is usually well-intentioned, not error: sensible defaults left running. One idle agent burned $1,500 in two weeks at a roughly 2,600-to-1 input-to-output ratio — proof that the leak is an operations problem, not a bug hunt.
The most expensive token is the one that your best person is afraid to spend.
Nofar Gaspar, The AI Daily Brief
The reasoning-token ambush
Tokens aren't priced equally. Input is cheapest, output runs three to five times input, and a hidden reasoning layer — invisible in the answer — is billed at the high output rate. A 400-token answer can sit atop 4,000 thinking tokens.
It's the part of the restaurant bill labelled kitchen time: you never see it, but you pay a lot for it. Reasoning tokens are billed at output rates across every major provider, so a short answer can carry a reasoning bill several times its size.
The metric that anchors an AI-native company
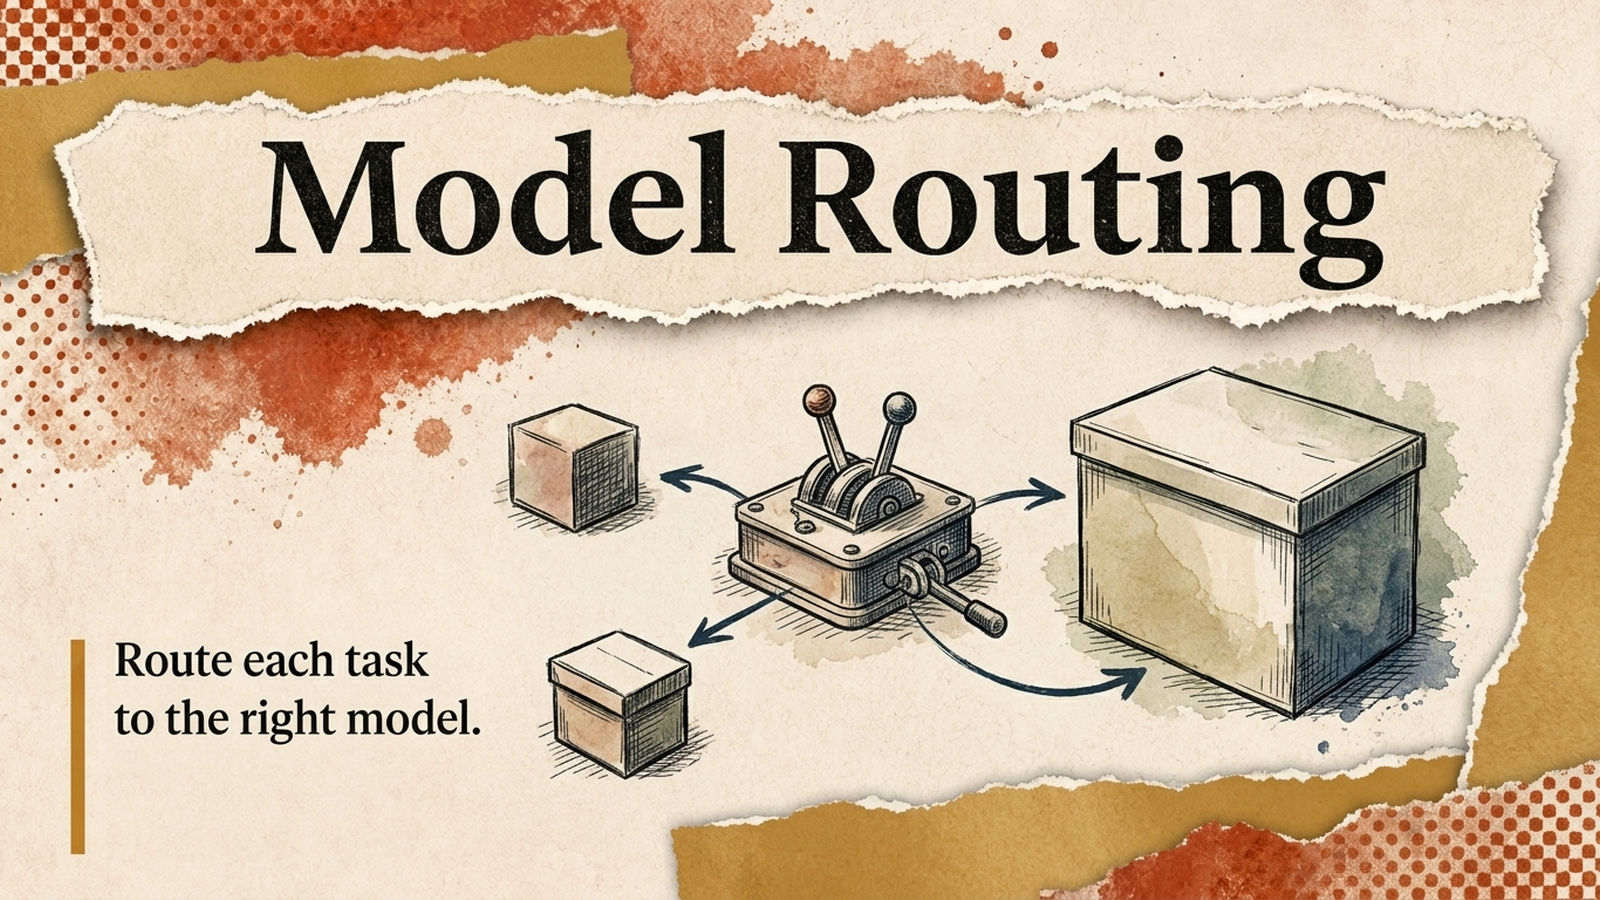
The same number is load-bearing when you build a company around agents. In a walkthrough of the AI-native playbook, token efficiency sits at the center: route models on cost per successful task, split heavy planning on expensive models from execution on cheap, fast ones, and track cost per accepted pull request as a first-class metric.
It's this page's accepted-task gate made concrete for engineering. The acceptance signal is a merged PR, so the metric stays honest by construction — you can't book a task as done until a human accepts the result.
Cost visibility is common; linking cost to value is not
KPMG's Global AI Pulse Q3 2026 puts numbers on the incomplete state this page names. Among organizations with established AI ROI, 48% consistently assess value against cost — only 12% overall. Dashboards, approval-time cost review, and token budgets are far more common in mature orgs than among experimenters. Visibility without valuation is still the default.
KPMG Global AI Pulse Q3 2026 (verified PDF / press release).
Spend is still rising with maturity — average planned AI investment jumped from US$186m in Q1 to US$210m in Q3 (+13%). Cost discipline here is maturation, not a spending freeze. Framing via Nathaniel Whittemore on The AI Daily Brief.
Cost visibility… is widespread. Linking it to value is the next step.
KPMG, via Nathaniel Whittemore / The AI Daily Brief
Spend wisely, not sparingly
The anxious reflex — capping usage to protect the bill — trades a visible line item for invisible foregone returns, and steers teams back to low-value work. The operator move is the opposite: meter per accepted task, then defend the experimentation budget on purpose.